Overview
As UX Lead, I designed a cross-functional framework so different projects could make design decisions with clear metrics, even in low data-maturity contexts.
My focus was structure, strategy, process and adoption. I did not design screens: I designed how the team frames problems, writes hypotheses and learns from evidence.
The Challenge
The team worked on projects where design was not always connected to business outcomes or evidence. I found:
Opinion-Based Decisions
Designers worked without clear metrics, and every project made decisions differently.
Low Impact Clarity
Design had difficulty proving value, prioritizing initiatives and gaining structured influence.
The core challenge was shifting opinion-based conversations into measurable decisions aligned with business.
Strategy and Process
I led a working system to move from “what should we design” to “what do we want to achieve and how will we measure it”.
Diagnosis
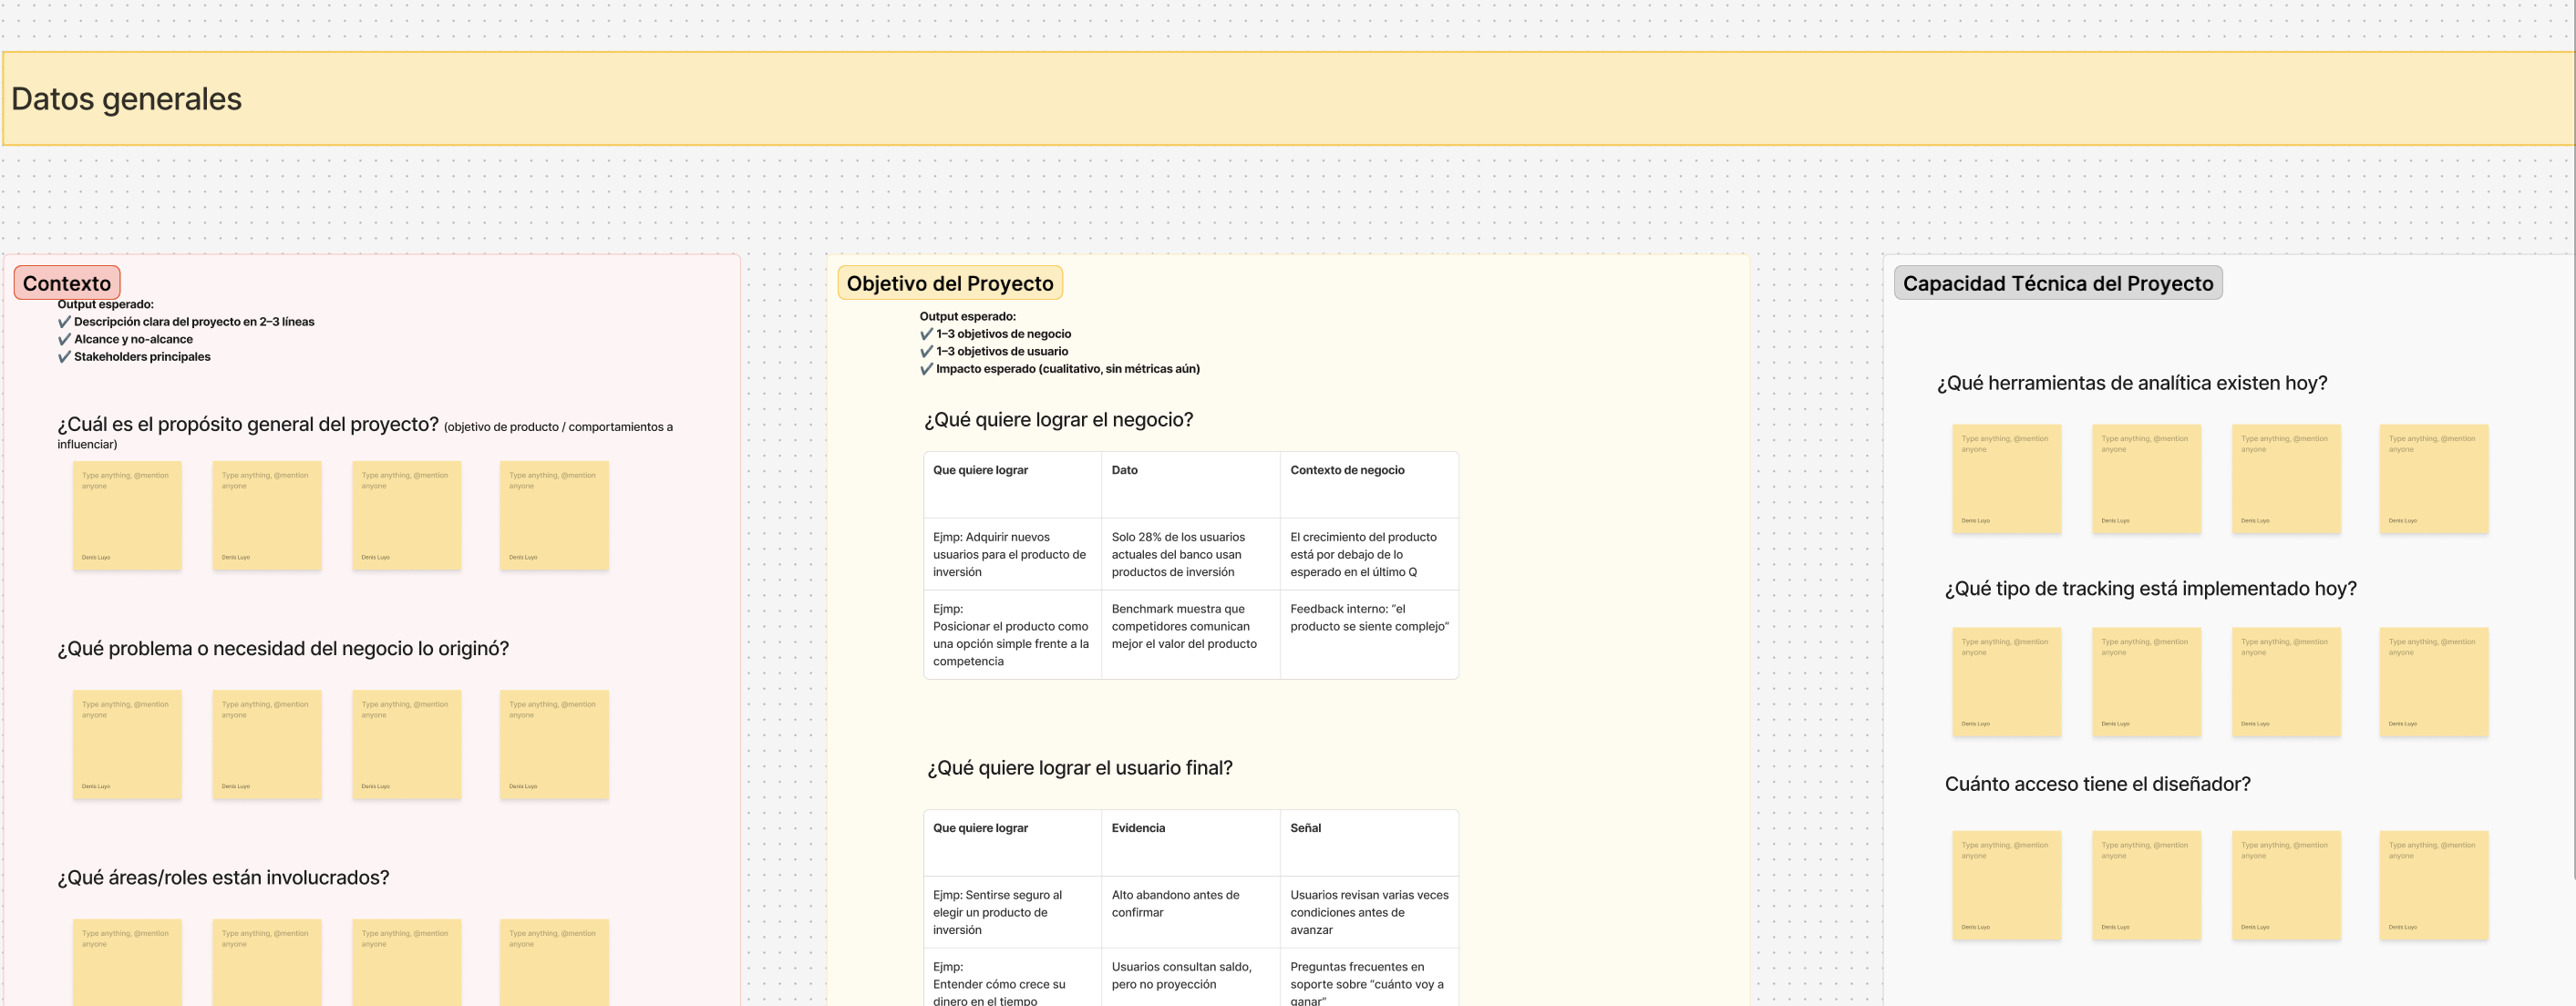
I facilitated Scope Canvas sessions to align the problem, objective and expected behavior.
Decisions
I defined that not every project should measure impact from day one; some needed exploration first.
Process
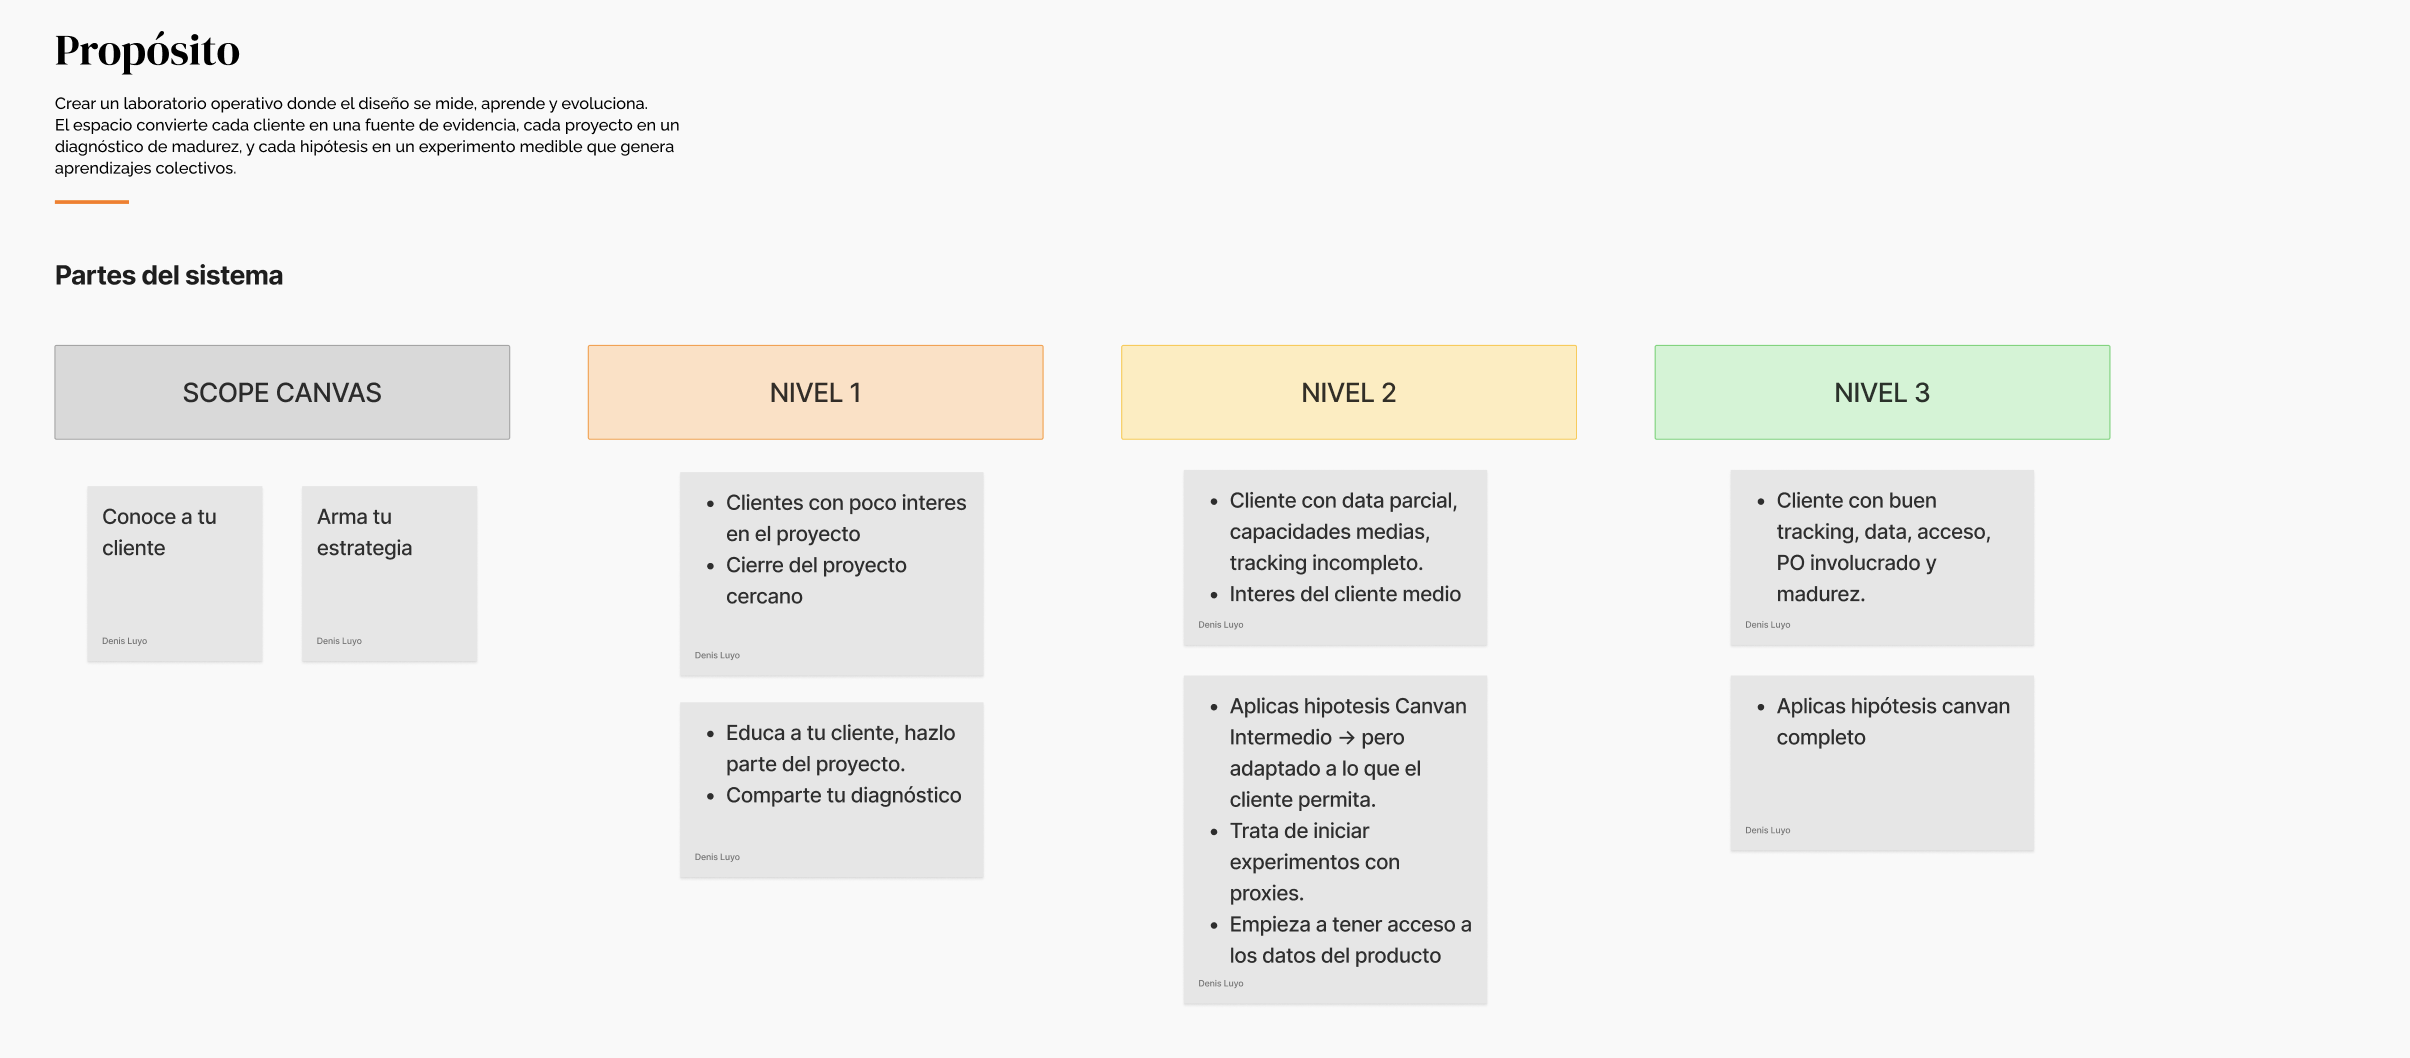
I introduced a maturity model, hypothesis system and repeatable learning structure.
High-Impact Solutions
1. UX Metrics Framework
I designed a complete system to connect business goals, design decisions and available evidence.
- Metrics framework adaptable by context.
- Maturity model with 3 project levels.
- Tracking system for continuous learning.
2. Scope Canvas and Diagnosis
I created the Scope Canvas to capture context, stakeholders, problem and goals before defining metrics.
I mapped flows and decision points to connect expected behaviors with metrics and learning.
3. Hypotheses and Learning
I designed a system to write hypotheses, decide what to measure and document learnings by maturity level.
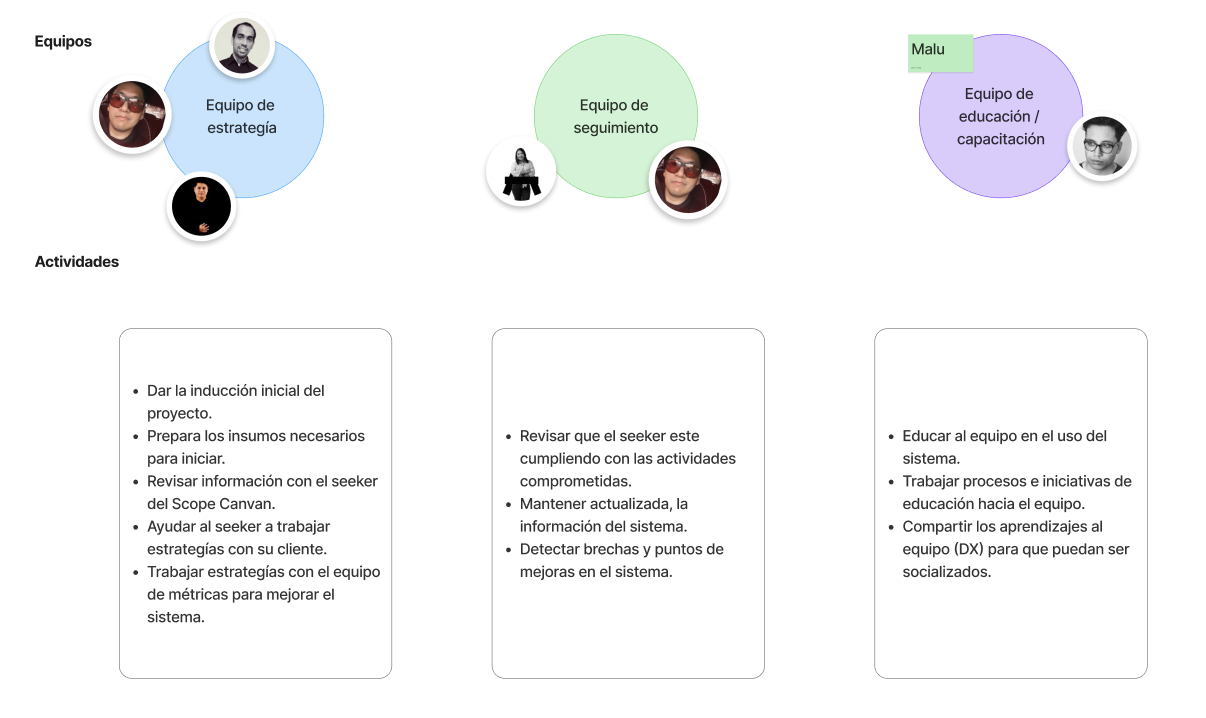
My contribution was making the process repeatable for a team of approximately 12 designers.
Results and Adoption
Projects with clear hypotheses to guide design decisions.
Decisions with some type of available evidence.
Maturity levels implemented to adapt the strategy.
Key Deliverables
Metrics Framework
Cross-functional system to connect design, business and data.
Maturity Model
3 levels to decide whether to measure impact or explore first.
Scope Canvas
Strategic diagnosis canvas to start projects with clarity.
Hypothesis System
Structure to formulate, measure and learn with evidence.
Project Gallery
Learnings and Leadership
-
01
Design With Systems
I learned that design does not scale without a system: it needs criteria, shared language and team adoption.
-
02
Metrics With Context
Metrics do not work without context; first, I need to understand maturity, goals and available evidence.
-
03
Leadership Through Judgment
I did not only design solutions; I designed a system so the team could make better decisions consistently.